UX/UI Redesign
Actionable insights not analytics
Active.AI is a fintech startup that specialises in conversational AI chatbots for financial institutions. They requested a redesign of their analytics to provide clients with better AI chatbot performance data.
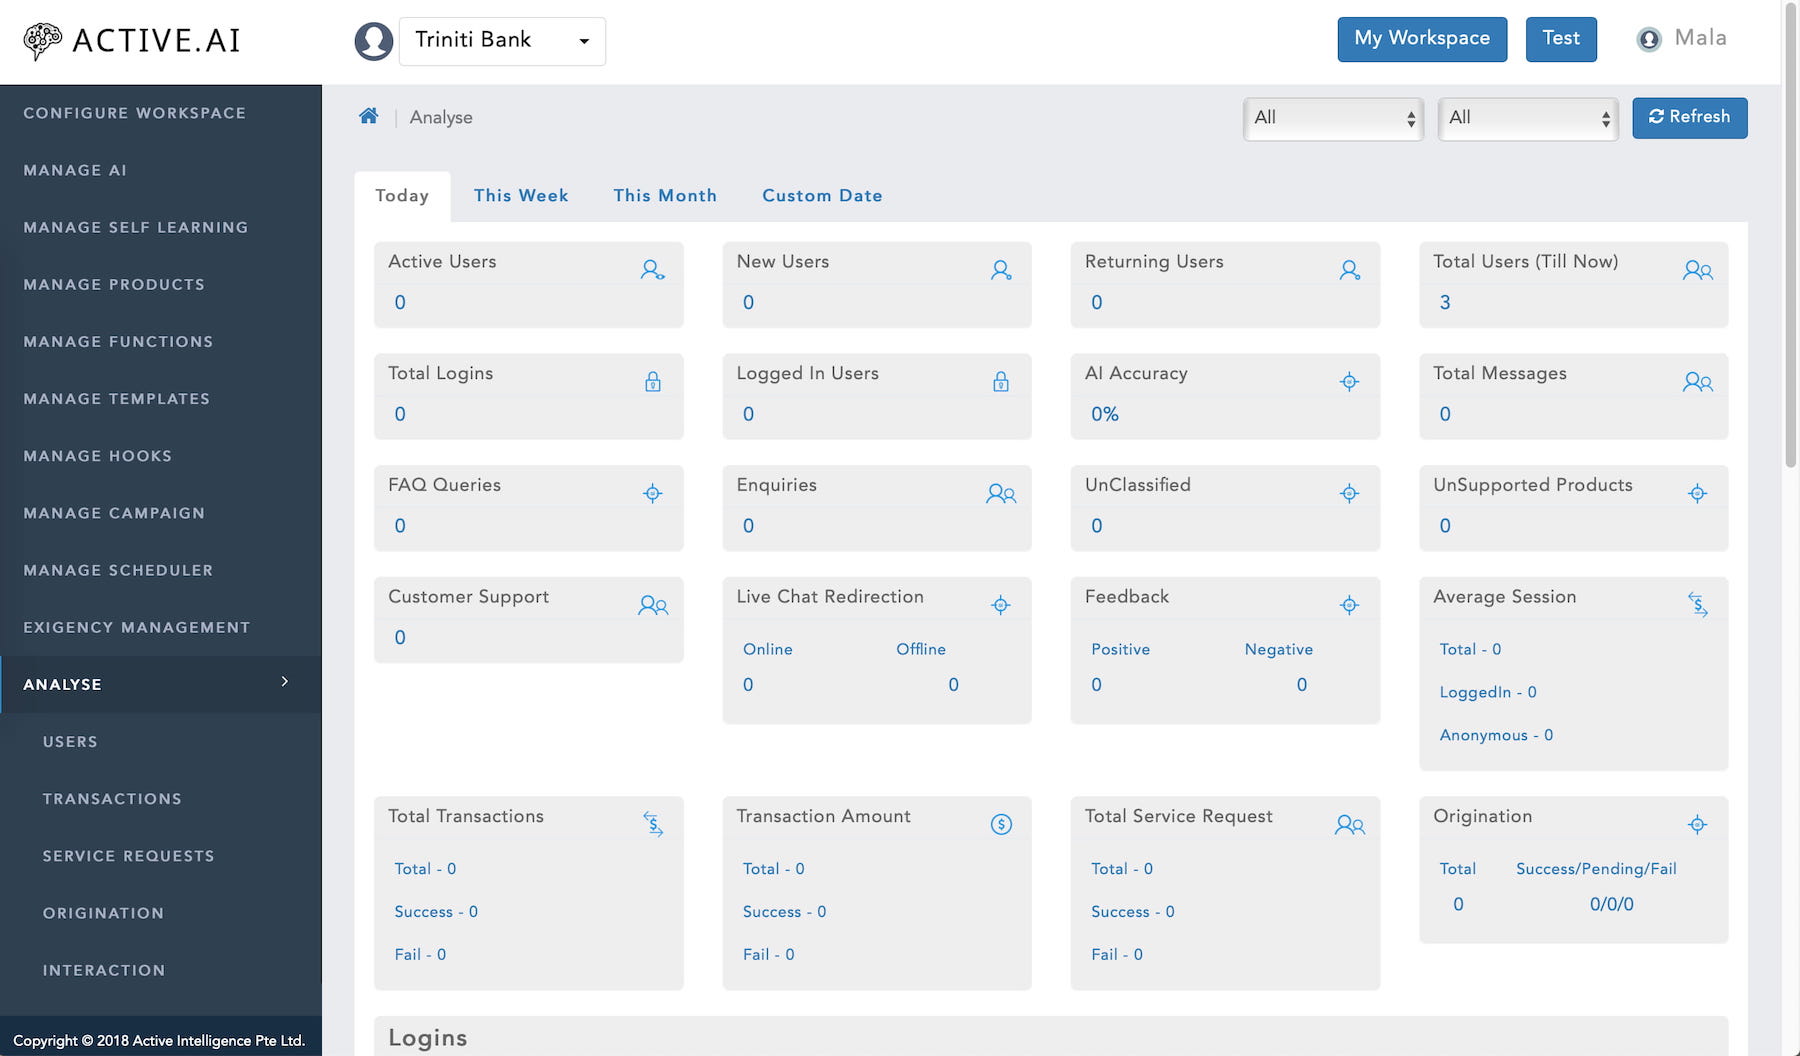
The existing analytics page design was not intuitive.
Unorganised, cluttered and included many unnecessary datapoints. It required users to analyse and interprete the data by themselves. At a glance, it was not easy to understand how the chatbot was performing. Trends and opportunities was hard to be identified.
Design Challenge
How can we enhance the analytics to show insights that is relevant for our clients to help them improve their customer's experience.
Research Findings
It is important not only to understand user feedback, but also analyse the competitive landscape and industry trend before any redesign.
Users
Quality data over quantity
Users Feedback
- Existing analytics included many redundant data points while lacking in data that was needed. Data such as popular customer timings and channel usages were missing.
- Interface was difficult to navigate and unpleasant to use.
Users Expectation
Technology should understand their customers and make timely connections that is relevant for them. Providing information they can act on to improve customer experience.
"We believe data is our oil, our gold, but having hundreds of millions of terabytes of data that isn’t actionable really does nothing for me."
— Rob Roy, chief digital officer at Sprint
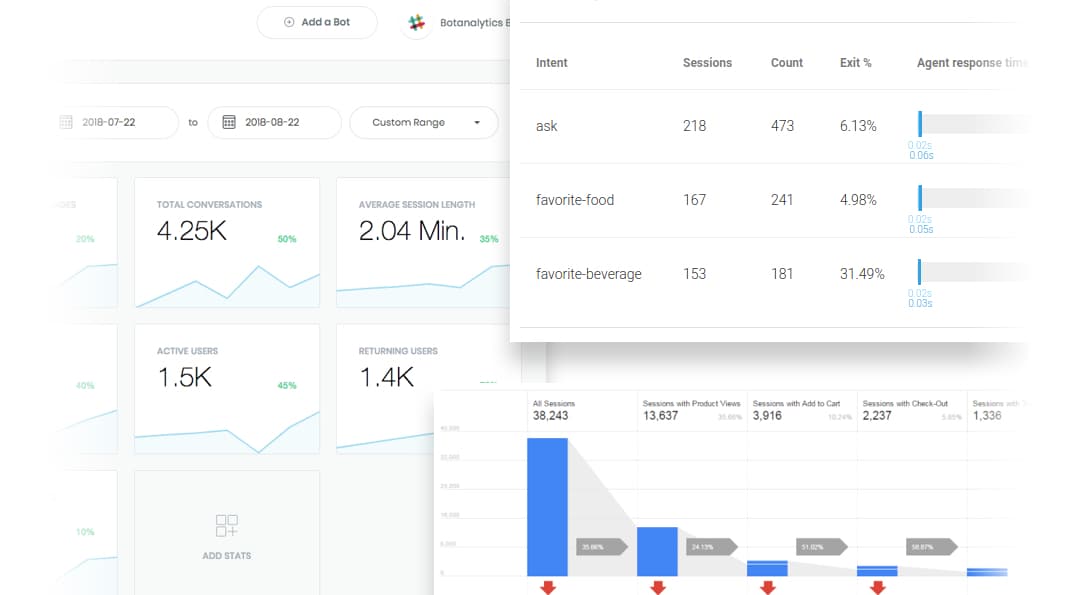
Competitive Analysis
Learning from the competiton
After conducting market research, we found no analytical platform in the market that fully addressed our user needs.
Bringing value to our users is priority than trying to reinvent the wheel. We researched numerous competitors and adopted certain features that added value for our users.
Industry Trend
Future of analytics — Augmented Analytics
Research by Gartner1, identified trends in analytics with augmented automated insights to deliver onto 75% of analytical platforms by 2021. Machine learning capabilities is able to surface hidden patterns and deliver new insights from the analytical data. With natural language processing translating algorithms’ findings into simple structured sentences.
Understanding customer’s end-to-end experience
Having a 360° view of user engagement across channels is important for companies2,3. Consolidated information like video views, time of app usage to chatbot requests enable companies to understand how consumers interact with the brand. Engaging and assisting customers at just the moment they need it.

Business Goals
1 Create & maintaining the customer connection
2 Shifting customer service towards automated agents
Having a clear understanding of our clients business goals from day one is important. Even when we are designing a small feature, knowing their goals help us set the right tone and direction.
Ideation
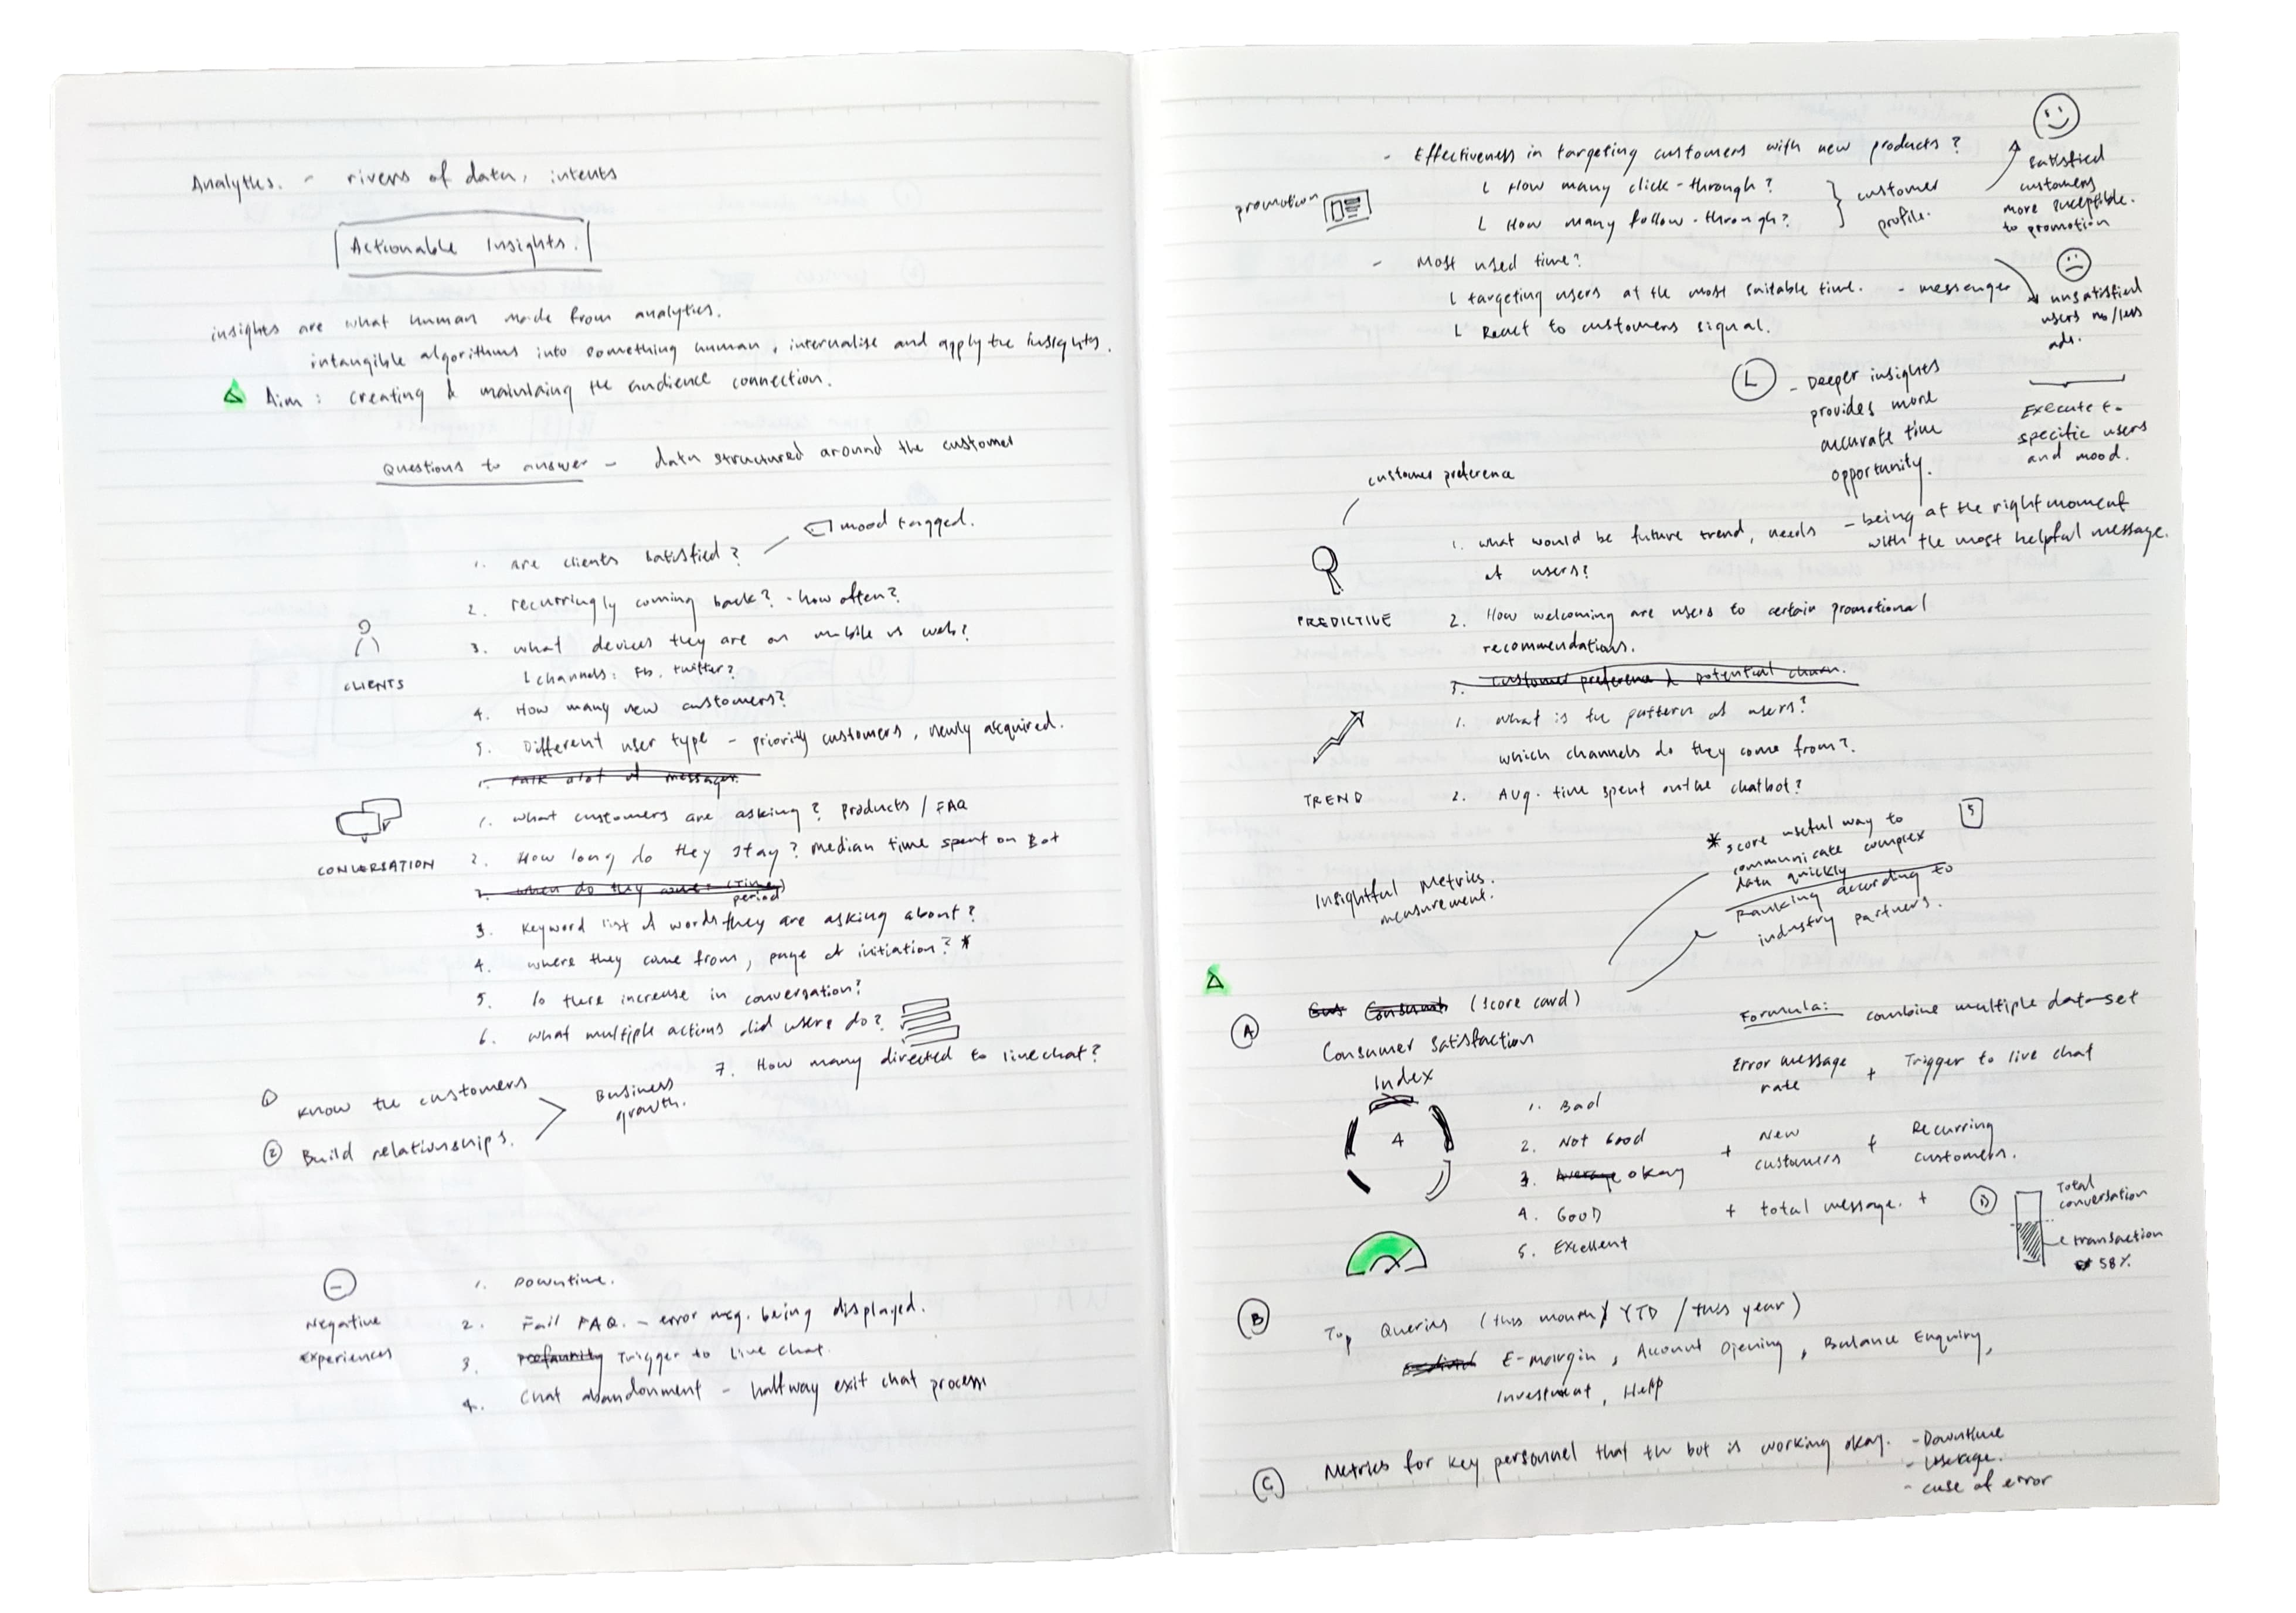
The ideation process merges our research findings (user needs, industry trends, competitiors) and the review of the current implementation. Focusing on ways to improve our users understanding of their customers.
Objectives
of redesign
We discussed with the team before we proceed in redesigning the analytics. Formalising a list of objectives that we should achieve.


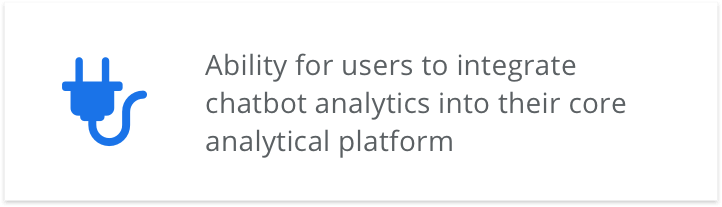
Information Architecture
We reorganised the metrices so they are categorised based on questions users are likely going to ask.
- Are customers satisfied with our service?
- What are the characteristics of my customers?
- What are my customer habits?
Grouping relevant data points together to answer specific questions.
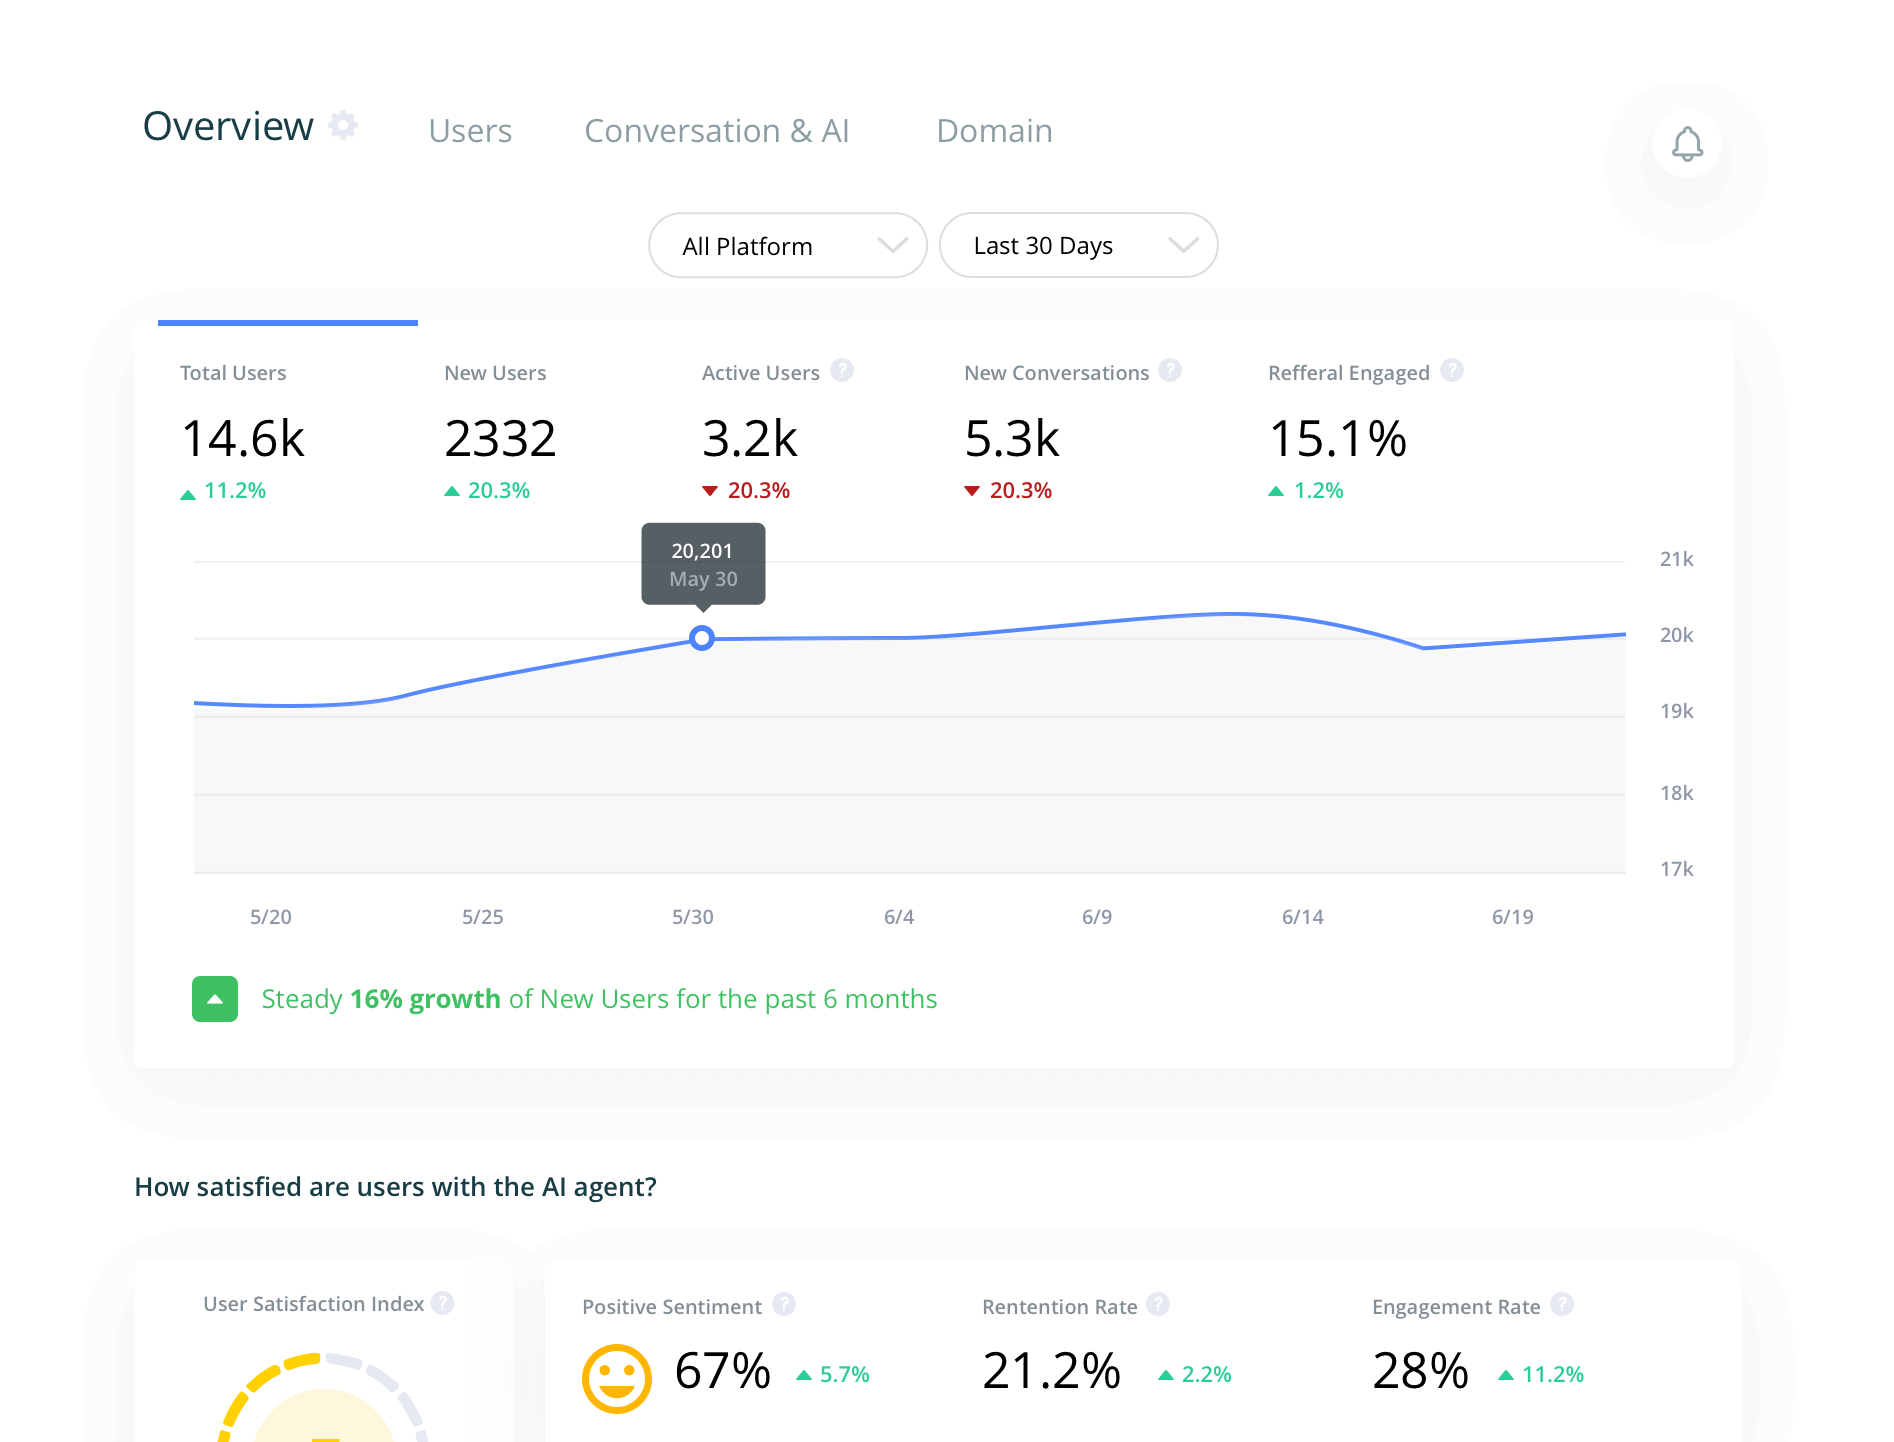
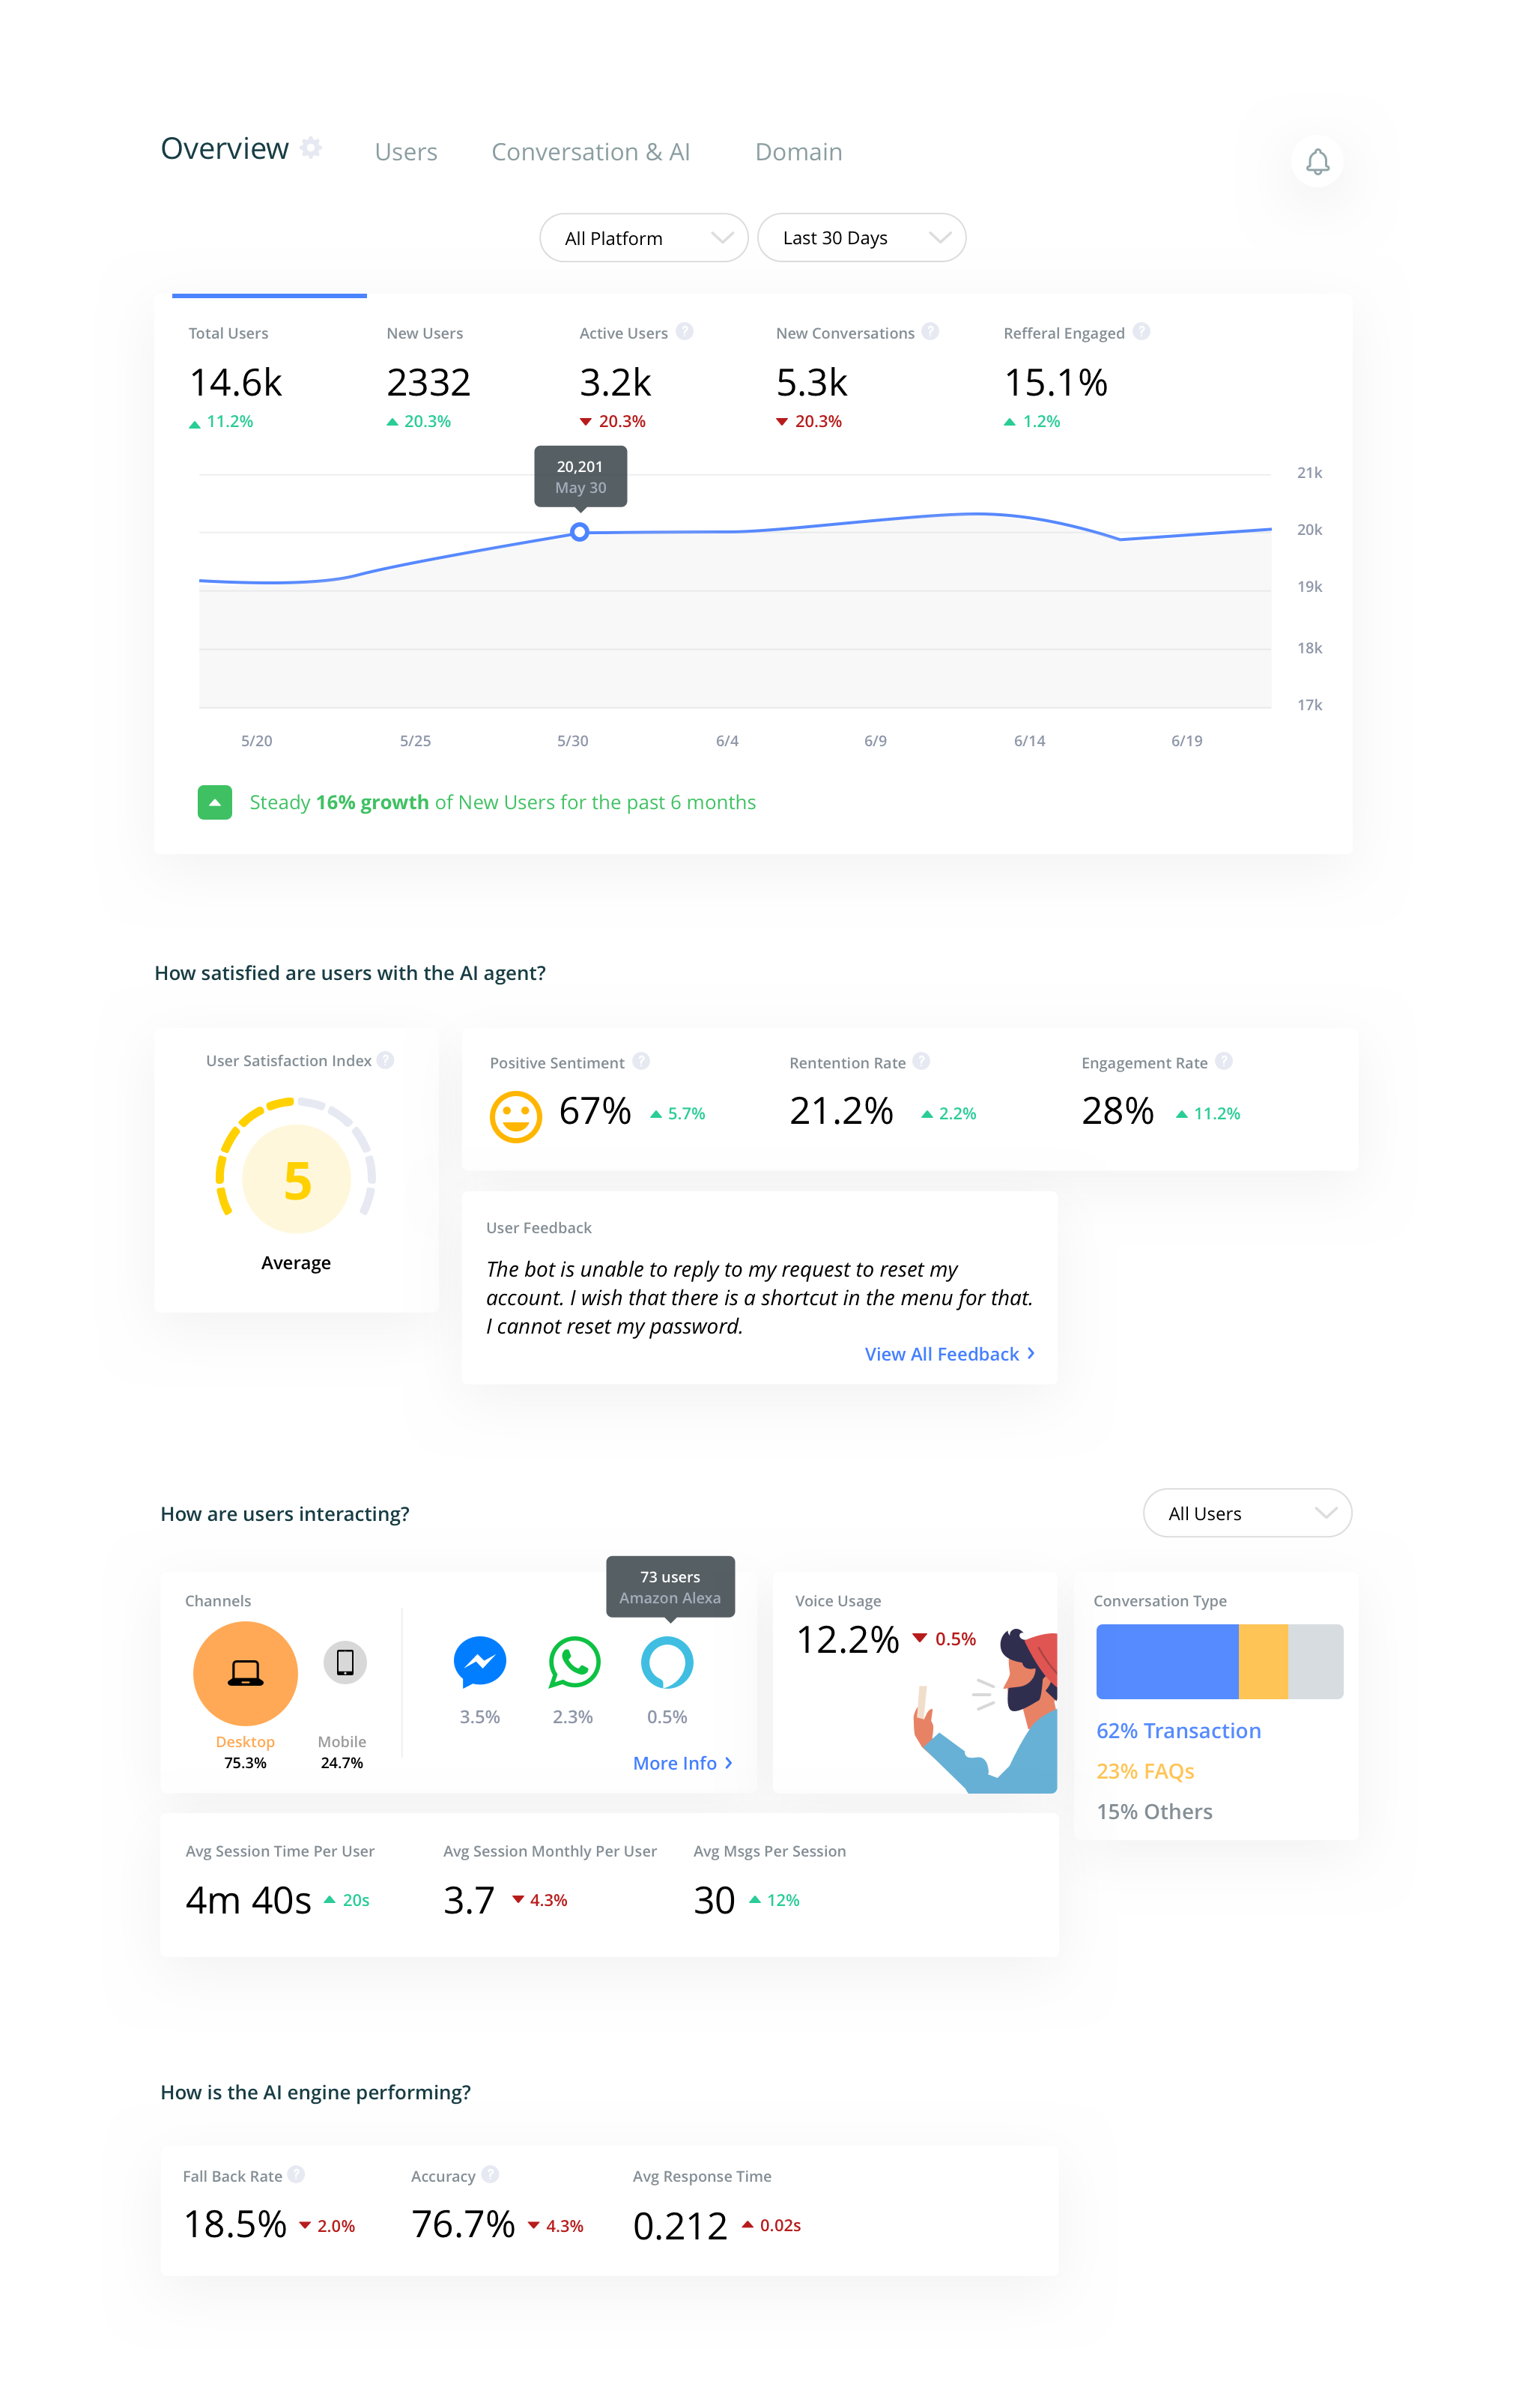
Redesigned Analytics
Focus on analytics that users can take action on. With better organisation of information to capture the full picture.
Infographic Design
Infographics are effective because they simplify information and make use of the human ability to see patterns and trends.
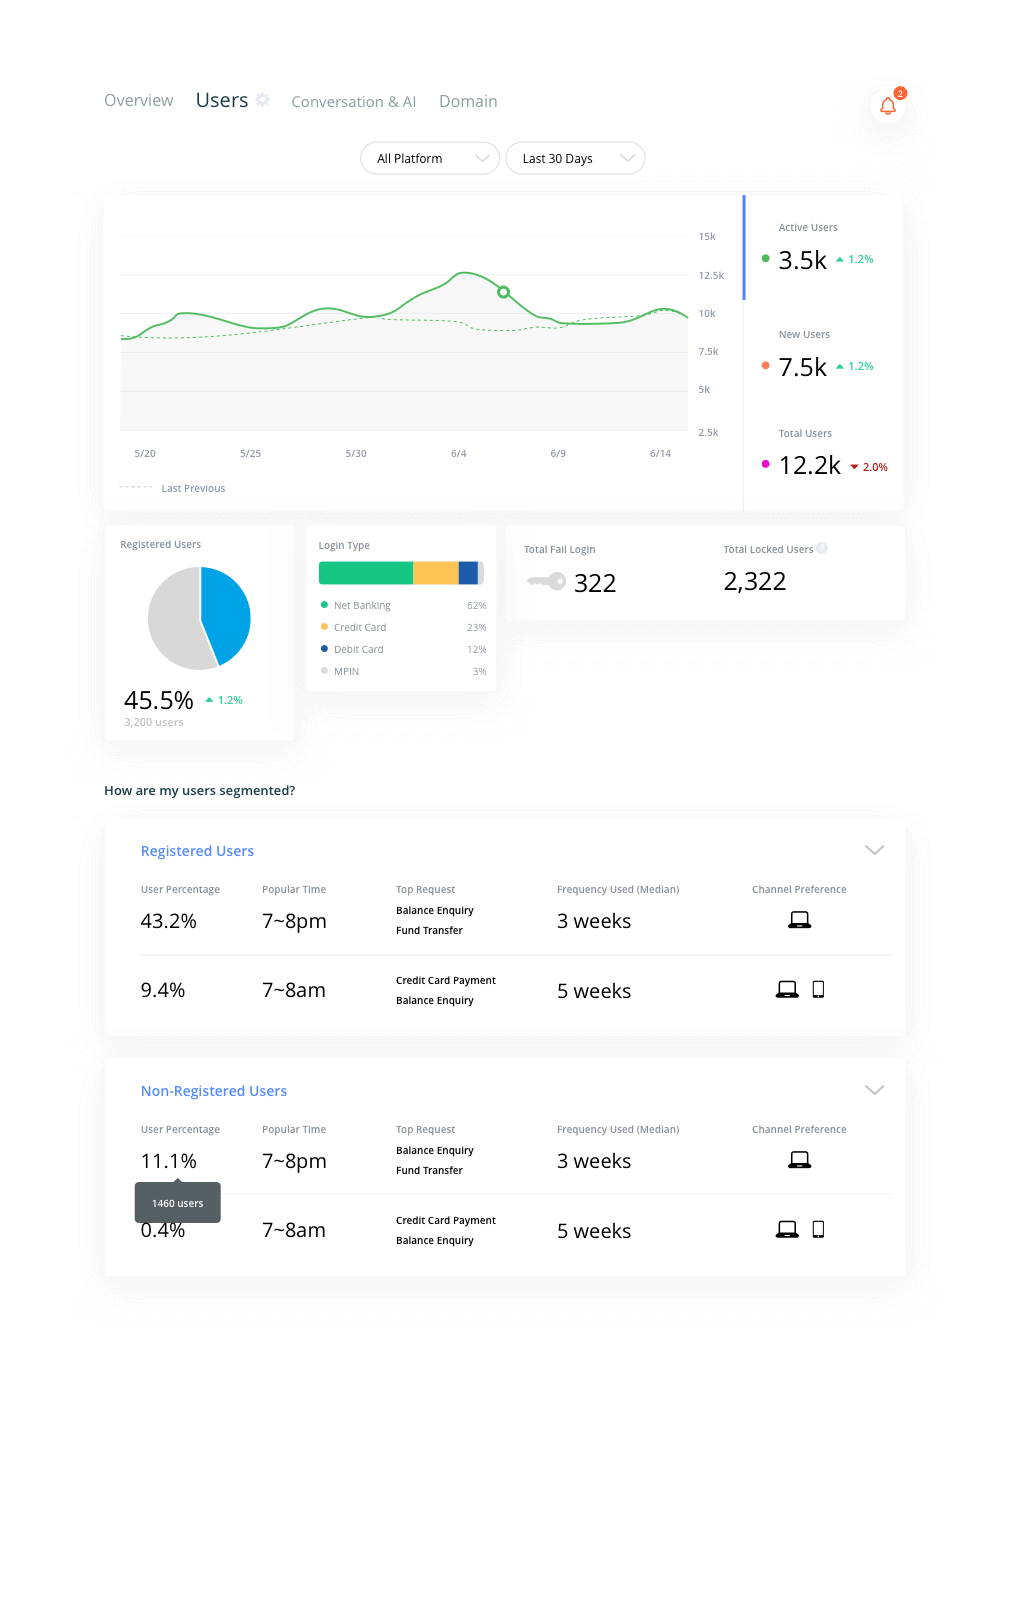
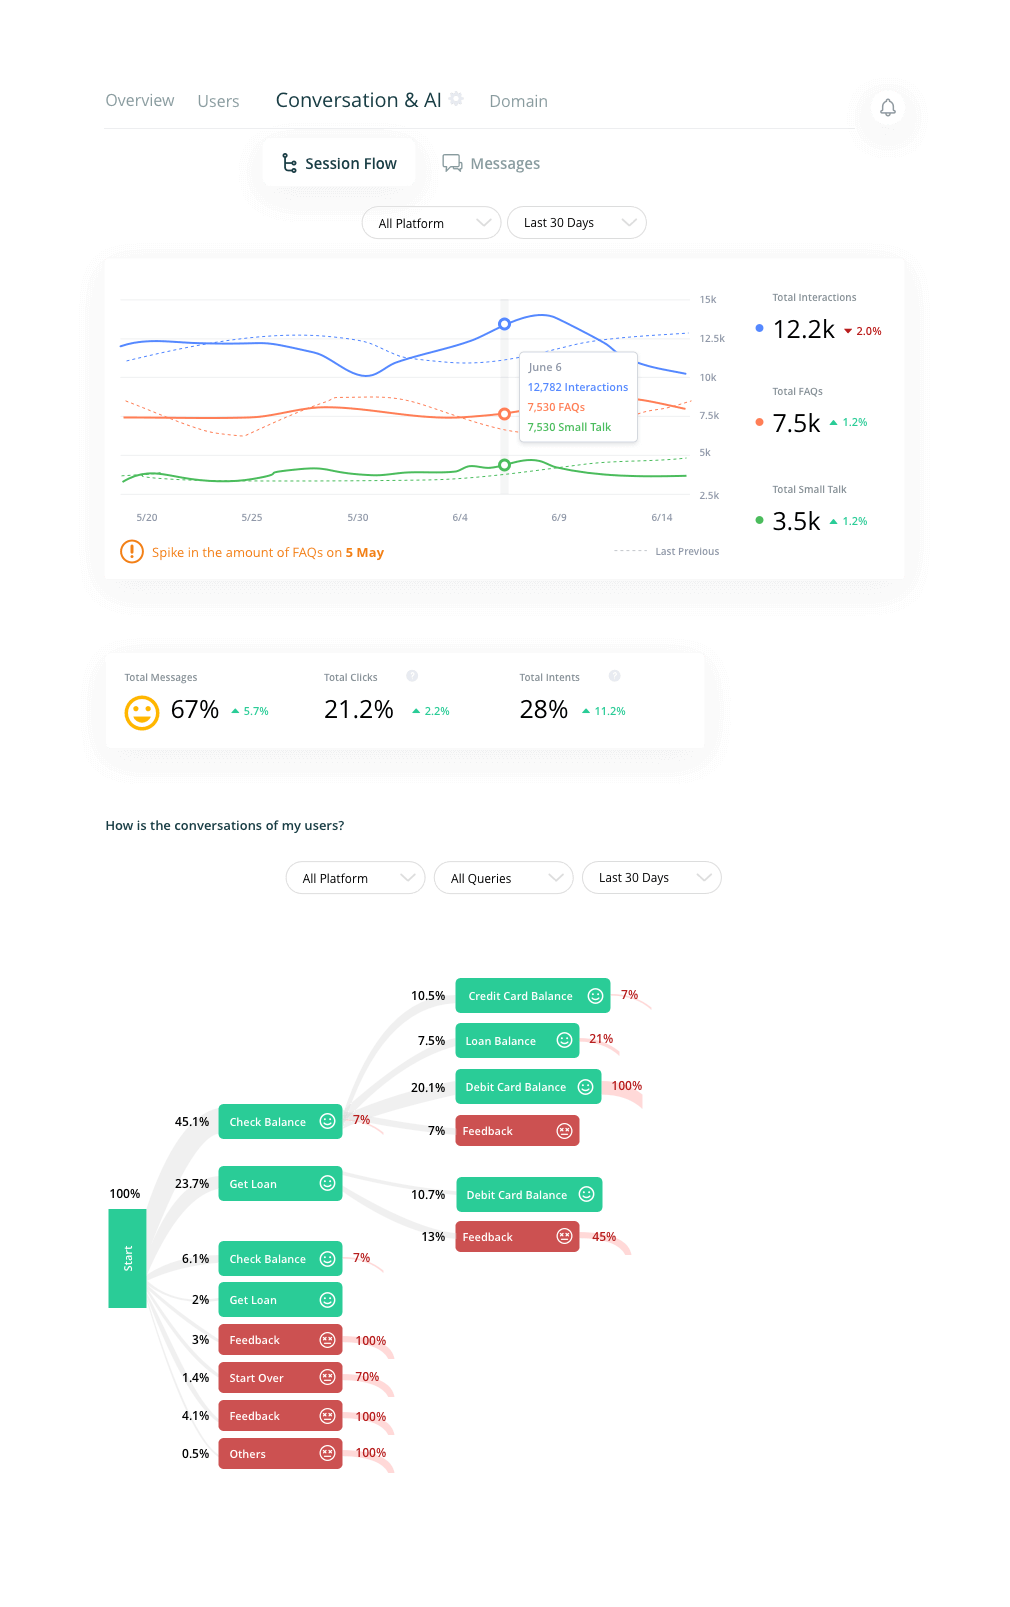
Overview Page
Single page overview gathers all the essential information. From customers usage, satisfaction, bot performance to transactions. Simple and informative report that can be shared across departments.
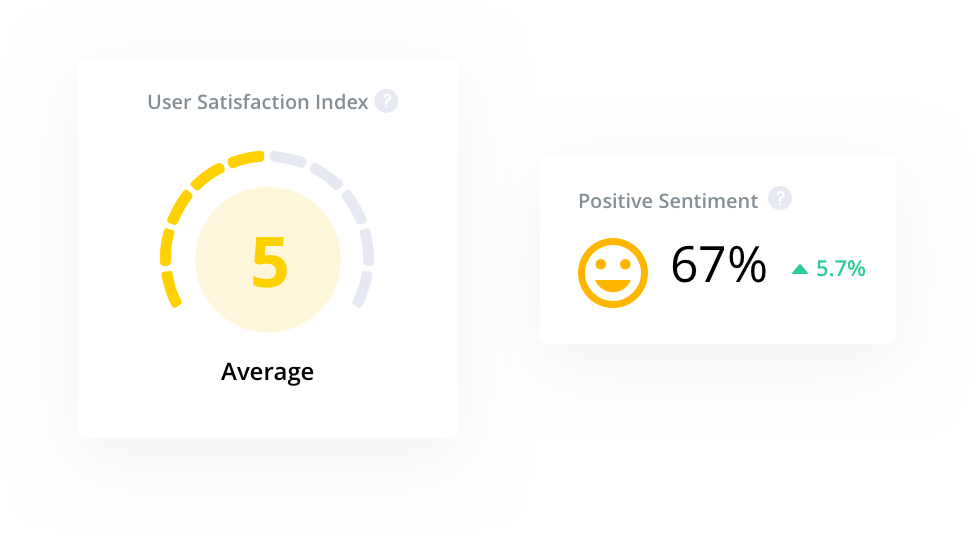
Scoring key metrics to communicate complex data quickly
Quick gauge of the current performance by combining multiple relevant data points.
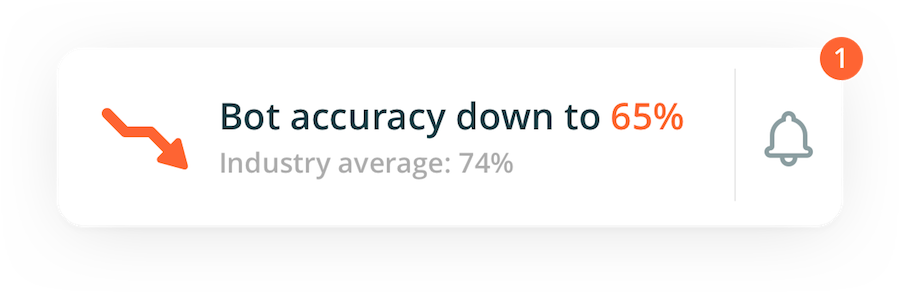
Alerts that matters
Alerts that matters
Users are alerted when critical problems first arise. Removing the need for constant monitoring and enabling faster intervention.
Users are alerted when critical problems first arise. Removing the need for constant monitoring and enabling faster intervention.
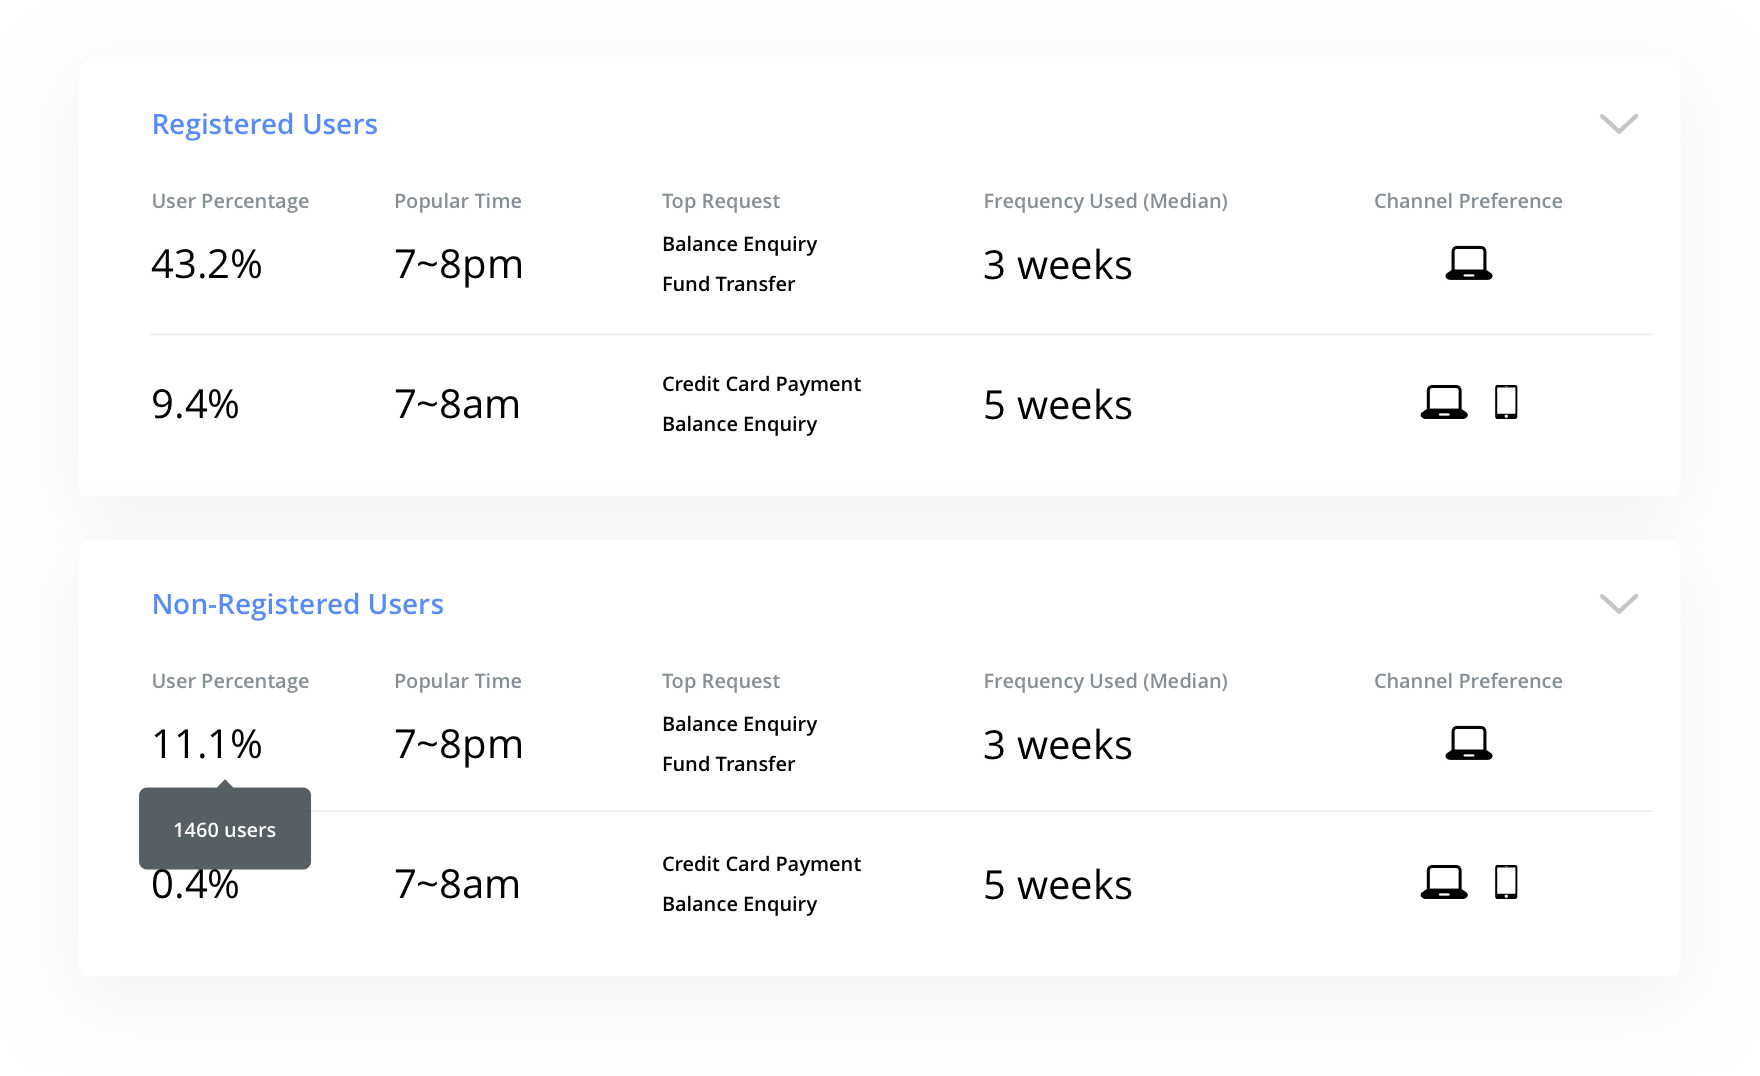
Customer segmentation
Analytics that automatically generate customer profiles. Allowing companies to create strategies & targeted messages for specific customers.
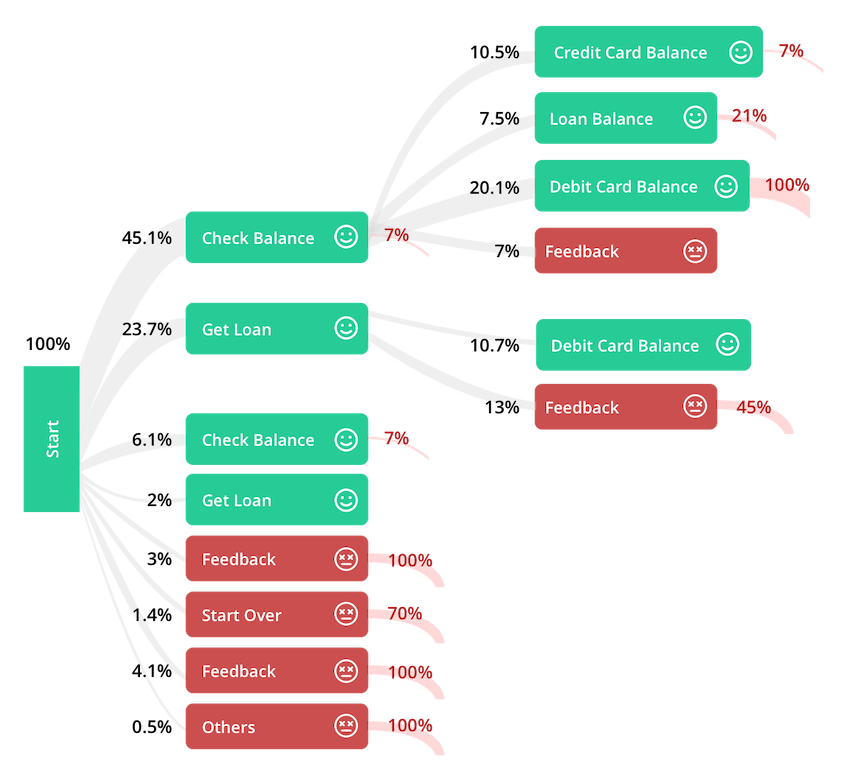
Tools to improve performance
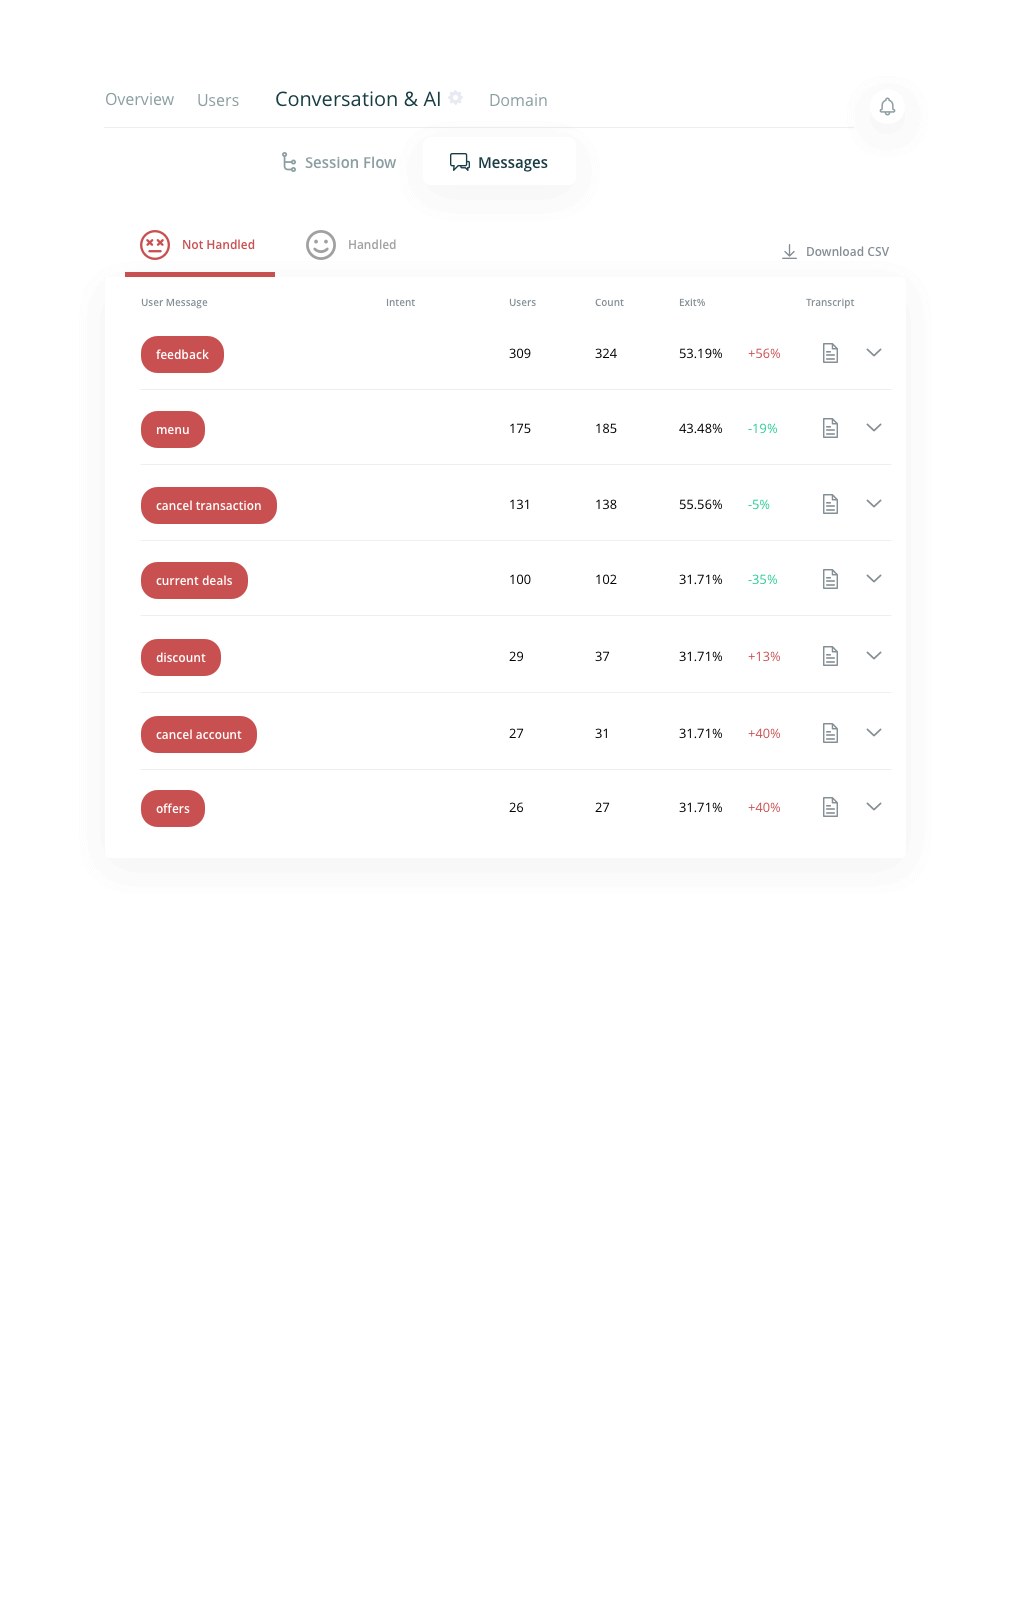
Allow users to improve chatbot response accuracy by showing the specific juncture where the chatbot failed to respond correctly.
Key Takeaways
Find a niche where you can perform and excel better than the competition.
Sources
1. Gartner: Augmented Analytics Is the Future of Data and Analytics - Article
2. Google: How integrated data and technology helped 3 companies transform their marketing - Article
3. McKinsey: From touchpoints to journeys: Seeing the world as customers do - Article
4. Intercom: Design principles: insights are not about analytics - Article
Next Project